Introduction to tablix
The Table, Matrix and List buttons on the Report Builder ribbon insert a tablix data region into the report.
Third party solutions
Got a database? Use Visual DB database form builder to build data entry forms.
What is a tablix?
Tablix is a flexible report item that can be used to display data in a grid format, with layout possibilities ranging from simple tables to advanced matrices.
The name comes from the fact that the Table report item and the Matrix report item (actually, List report item too) from older versions of Reporting Services have been combined into one super report item. In other words, table + matrix = tablix. Tablix doesn't just combine the capabilities of tables and matrices, it has extra capabilities that neither had.
Although buttons for Table, Matrix and List report items continue to be available in Report Builder's ribbon they are really just tablices with different starting layouts. Since they are all tablices underneath you can start with any of these items and manipulate the groups, rows and columns to convert it into the one of the other items. More info »
But the real power of Tablix comes not from the fact that you can convert a table to a matrix and vice versa, but from the fact that you can combine the features of tables and matrices in a single grid. Here's an example:
In the grid below the first three columns are static, just like columns of a regular table, but under Sales you have dynamic columns (highlighted in purple) just like columns of a matrix. These columns are "dynamic" because how many of these columns you get depends on the data.
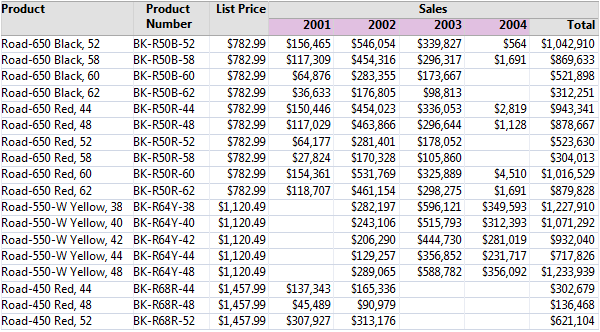
Download RDL for the above tablix. (Uses AdventureWorks sample database.)
In previous versions of Reporting Services you had the Table report item which could only have static columns, and you had the Matrix report item which had dynamic columns, but with Tablix you can freely mix static and dynamic columns.
In the example below there are two sets of dynamic columns (highlighted in purple and green). In previous versions of Reporting Services you could use a Matrix report item to get one set of dynamic columns, but it was not possible to have two sets of dynamic columns side-by-side as in this example. Note that in this example, on rows you have two groups nested inside each other (Category and Subcategory) and on columns you have two groups not nested, but adjacent to each other (Year and Territory).
Also note that the row labels are displayed in a compact form: Category labels and Subcategory labels don't occupy two separate columns; instead they are displayed in the same column, with Subcategory labels indented under Category labels. This is a new capability introduced by Tablix, not available in the Matrix report item of older versions of Reporting Services.
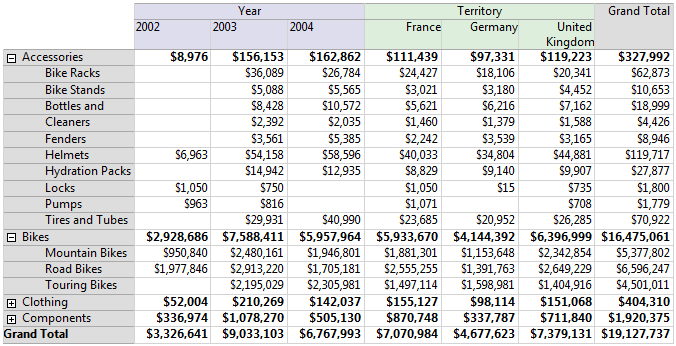
Download RDL for the above tablix. (Uses AdventureWorks sample database.)
Yet another new capability of tablix is that it gives you total control over subtotals. In the Matrix report item in previous version of Reporting Services you could turn subtotals on or off — that was the extent of control available, and if turned on subtotals will be shown for values displayed in the body of the Matrix. With tablix you have much more control — subtotals and body are fully independent. For example you can show Sum, Count and Avg in the subtotals even though only Sum is displayed in the body. Or you can show Sum and Avg in the body while only showing Sum in the subtotals. Or you can show two values in the body of the tablix but only show subtotal of one of the values, and so on.
In the example below the body of the tablix shows Sum of Sales broken down by Year, but the subtotals on columns shows Sum of Sales, Count of Sales and Average Sale.
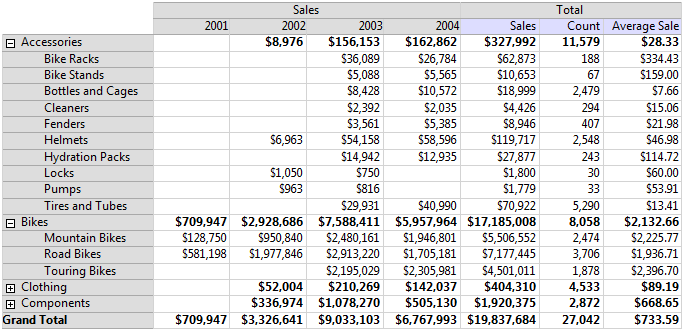
Download RDL for the above tablix. (Uses AdventureWorks sample database.)
Also worth mentioning is the fact that columns and rows of a tablix have the same capabilities. Anything you can do on columns you can do on rows. So you can have adjacent groups on rows, and row totals have the same flexibility as column totals.
Copyright (c) 2010 gotreportviewer.com